Elk stack once and for all!
Welcome to this quick guide on using the ELK stack, specially Elastic’s Kibana interface to search, filter and create visualizations and dashboards, taking as an example the investigation of vpn logs for anomalies.
Is a collection of different open-source software developed by Elastic, linked together to take data from endpoints (computers, networks, any source in particular) in any format and being able to perform a search, analyze and visualize the data in real-time.
One works with the other, it’s like you have a VR headset without a VR video to watch, or you have a VR video without any VR headset to visualize with, let’s look it more in-depth:
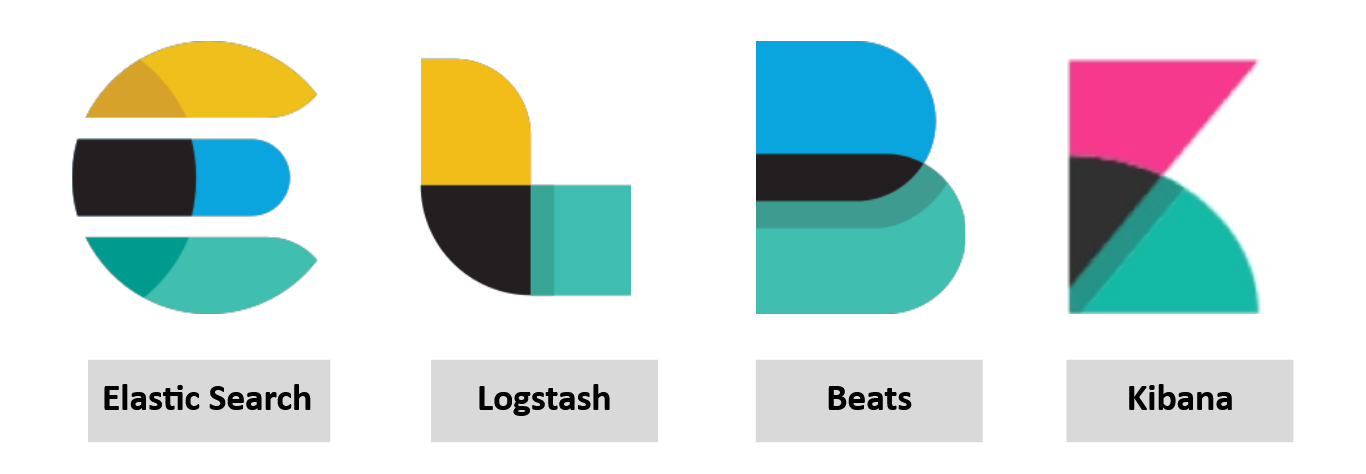
ElasticSearch
Is a full-text search and analytics engine used to store JSON documents, being a critical part since is the component used to store, analyze, perform correlation on the data and so much more, having a RESTfull API to interact with it.
Logstash
Data processing engine used to take the data the data from different sources, apply a filter or normalize it, and then send it to the destination, being the majority of the cases a elasticsearch database, kibana or a listening port, being separated like this:
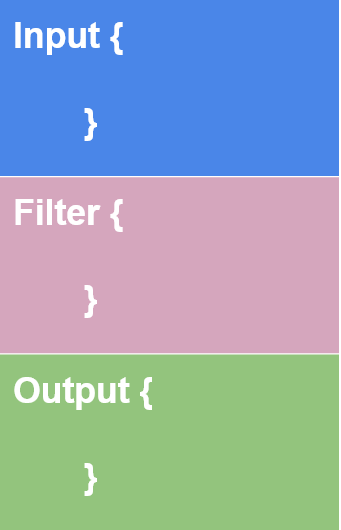
Input
User defines the source where the data is ingested, while it has a lot of input plugins like azure events, is better to use beats to follow the stack.
Filter
Where the user defines the filter options to normalize the data, for example: age, bytes, clones and more.
Output
This is the part where the filtered data is sended to a listening port, elasticsearch database, or kibana.
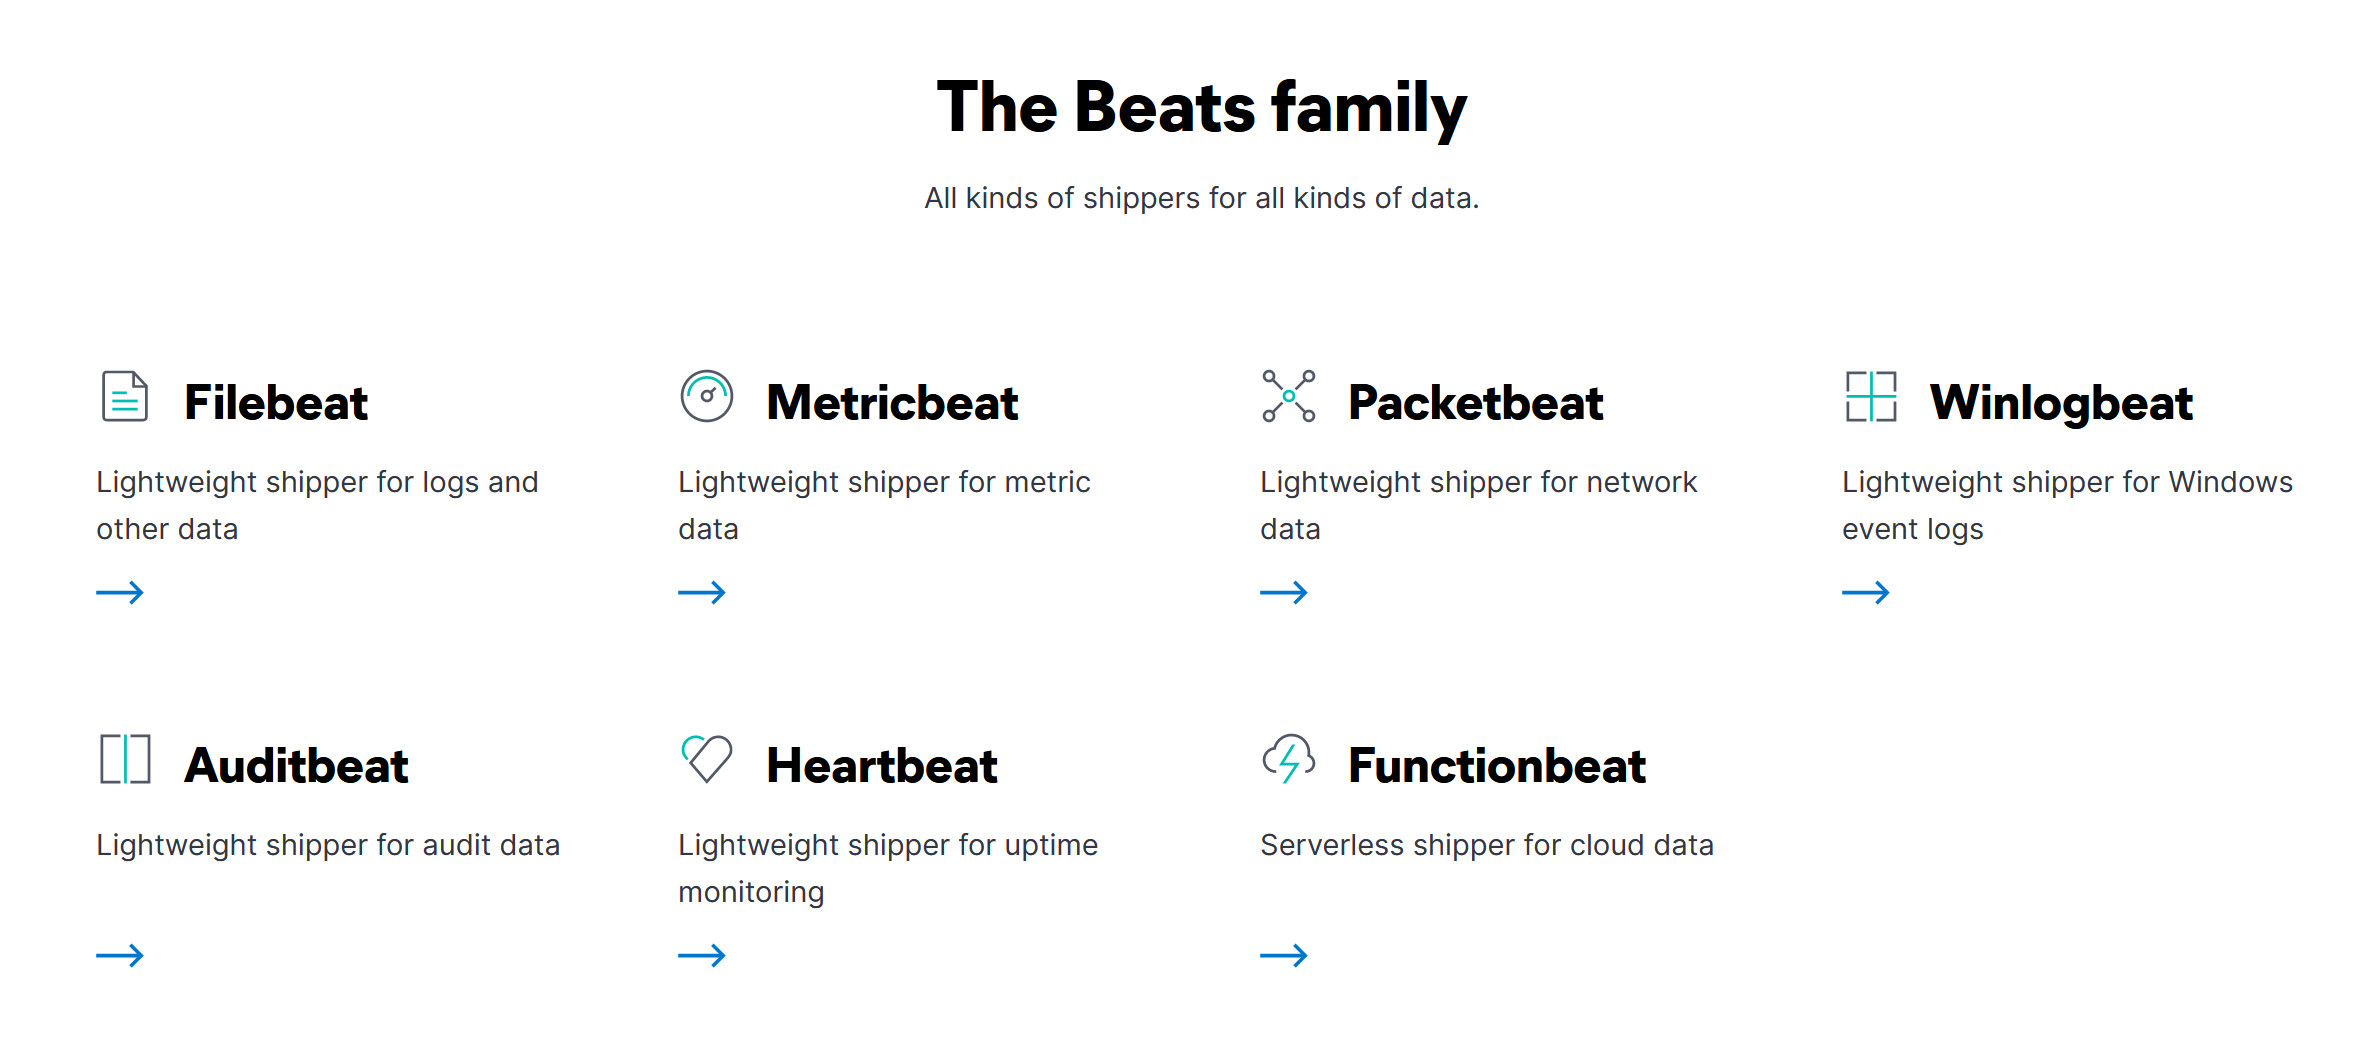
Beats
Host-based agent (Meaning that is a program that you install or set up for each of your devices) known as data-shippers since it’s used to send data from the endpoints to logstash, or elasticsearch, for example all the “beats” available:
Kibana
Is a web-based data visualization that works with elasticsearch to analyze, investigate and visualize the data stream in real-time, you can create multiple visualizations, dashboards and specific lookups with KQL (Kibana query language) more on that later.
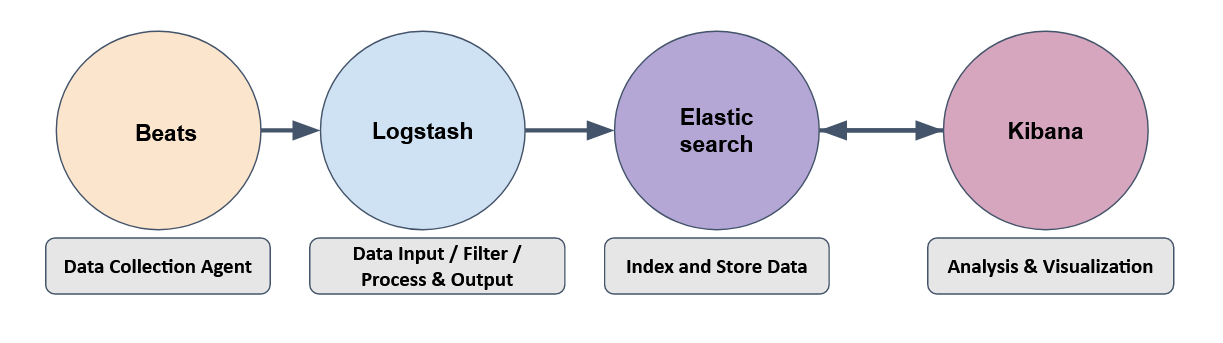
How they work together
Getting our feets wet with Kibana
This is the discover tab in our Kibana instance, if you have used Splunk before, they are fundamentally the same, and that’s why it’s going to be easy to get started with, since they are both SIEMs.
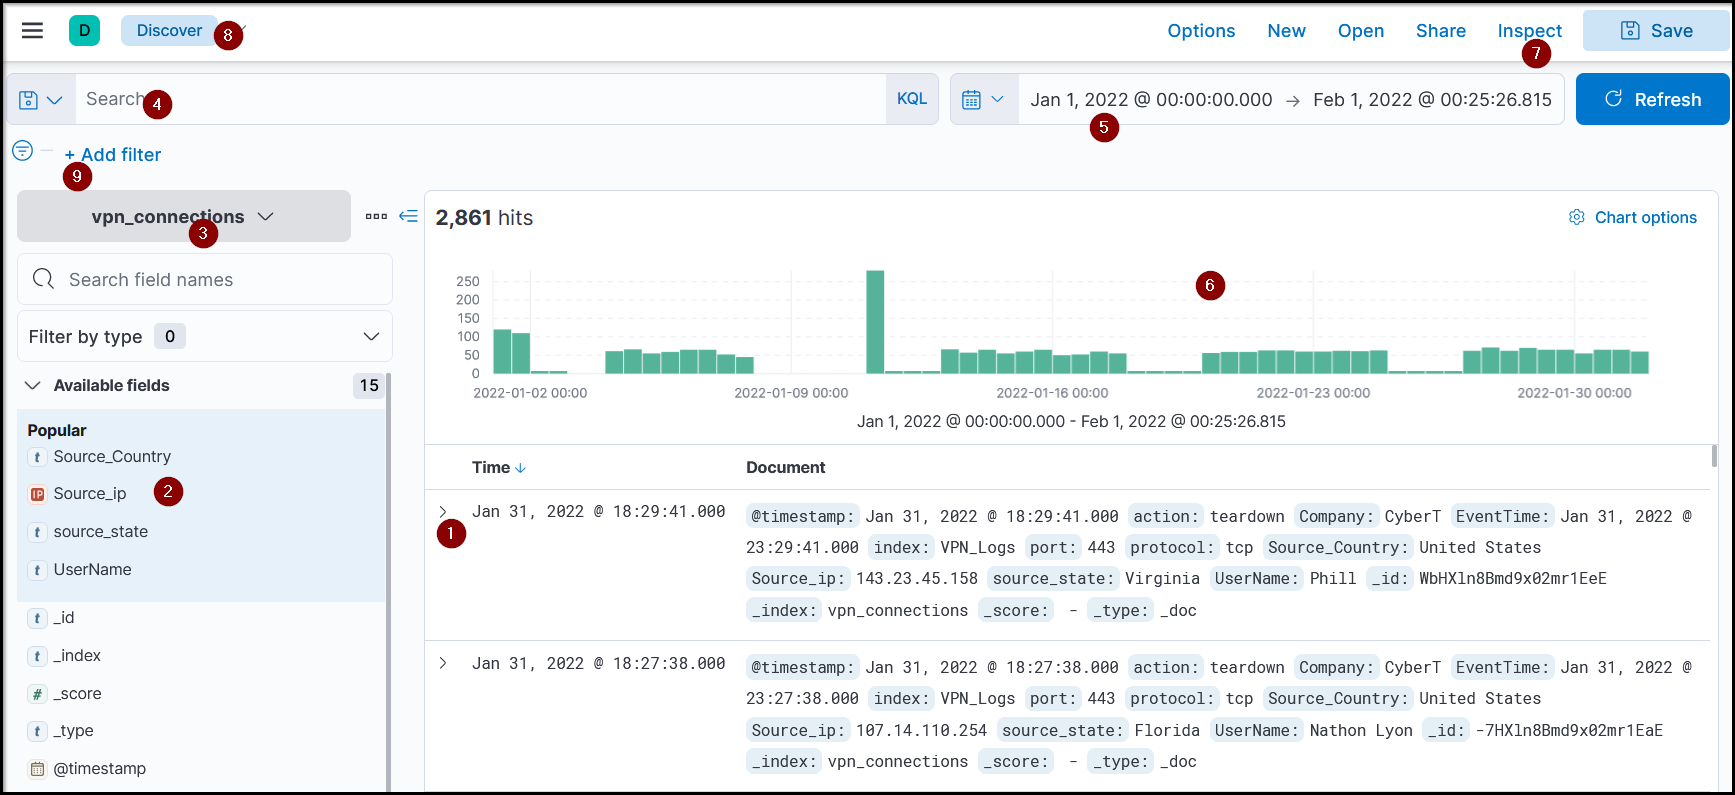
- Logs (document): Each log here is also known as a single document containing information about the event. It shows the fields and values found in that document.
- Fields pane: Left panel of the interface shows the list of the fields parsed from the logs. We can click on any field to add the field to the filter or remove it from the search.
- Index Pattern: Let the user select the index pattern from the available list.
- Search bar: A place where the user adds search queries / applies filters to narrow down the results.
- Time Filter: We can narrow down results based on the time duration. This tab has many options to select from to filter/limit the logs.
- Time Interval: This chart shows the event counts over time.
- Inspector: This tab helps us understand the request Kibana is doing to elasticsearch, by seeing the json structure.
- Application: Is the name of the application we are using, in this case Discover, we can save our session to return to it later or manage the saved sessions.
- Add filter: Self-explanatory, it helps us add specific filters with logical operators.
Our best friend here is the fields pane since it gives us a brief overlook about all the information and helps us to filter them fast.
KQL
The Kibana Query Language is a search query language used to search the ingested logs in the elasticsearch, it does not have tons of features but it is really easy to pick up, another option is the Lucene Query Language (LQL) so is opt to the user.
Free text search
Here you can put any text into the box and it will search it irrespective of the field, for example:
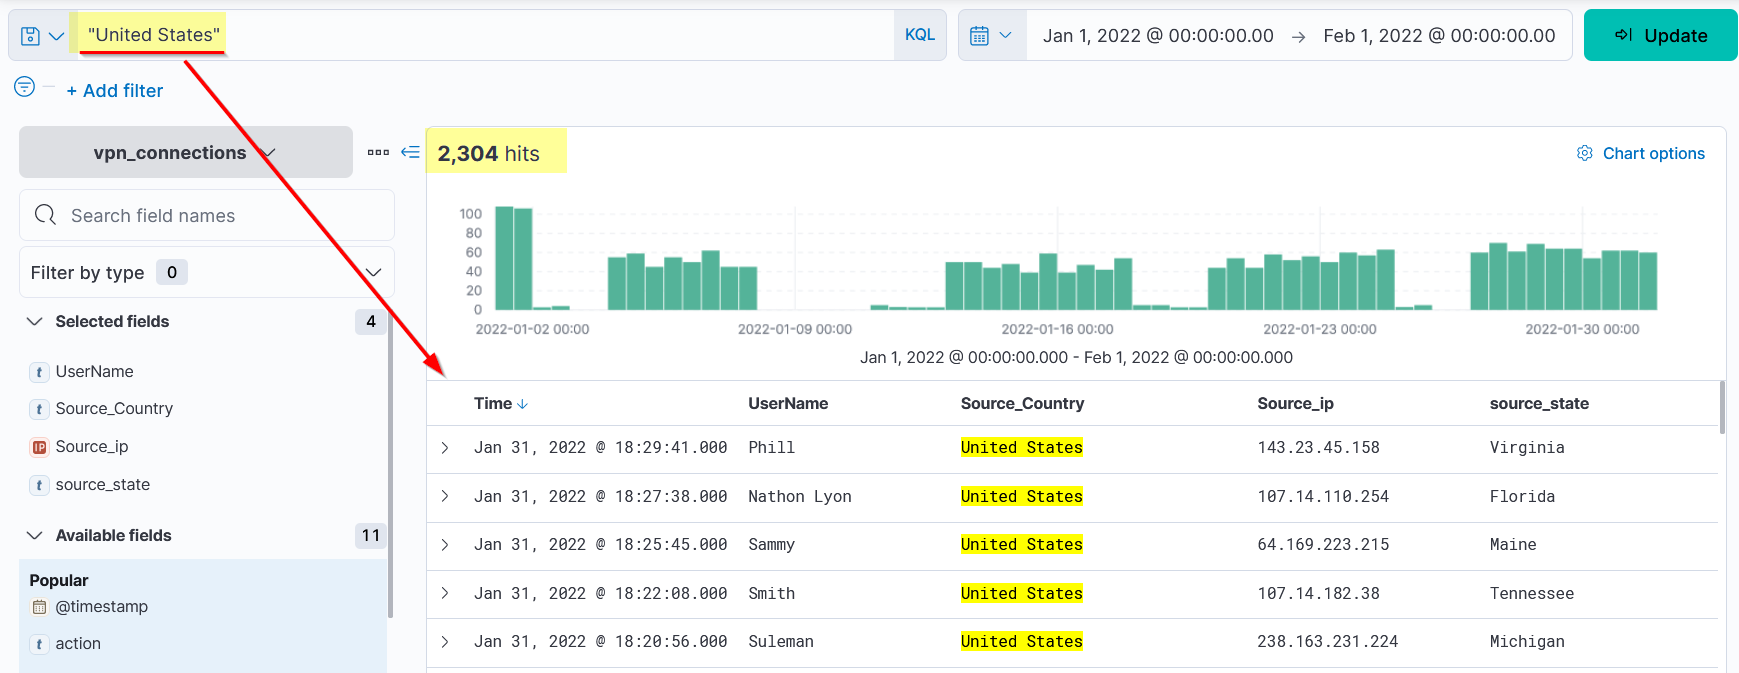
But what happens if we only search for “United”?
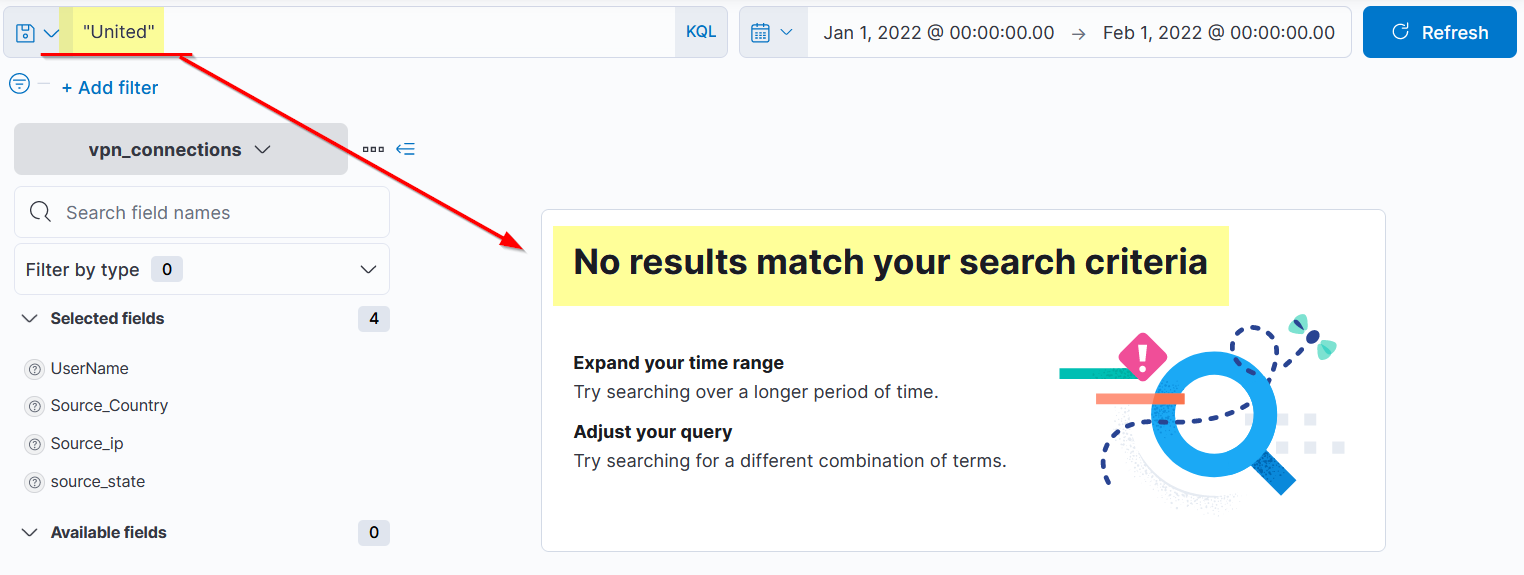 It will not return any result because KQL looks only for the whole term, here is where wildcards come into play.
Wildcards
Let’s use them! But before that let’s do a quick rundown on wildcards:
*: To match any characters and there is no limit to their number?: To match any single character[characters]: To match any character inside the[][!characters]: To match any character that is not inside the[]{}: To match a group of names/wildcards patterns
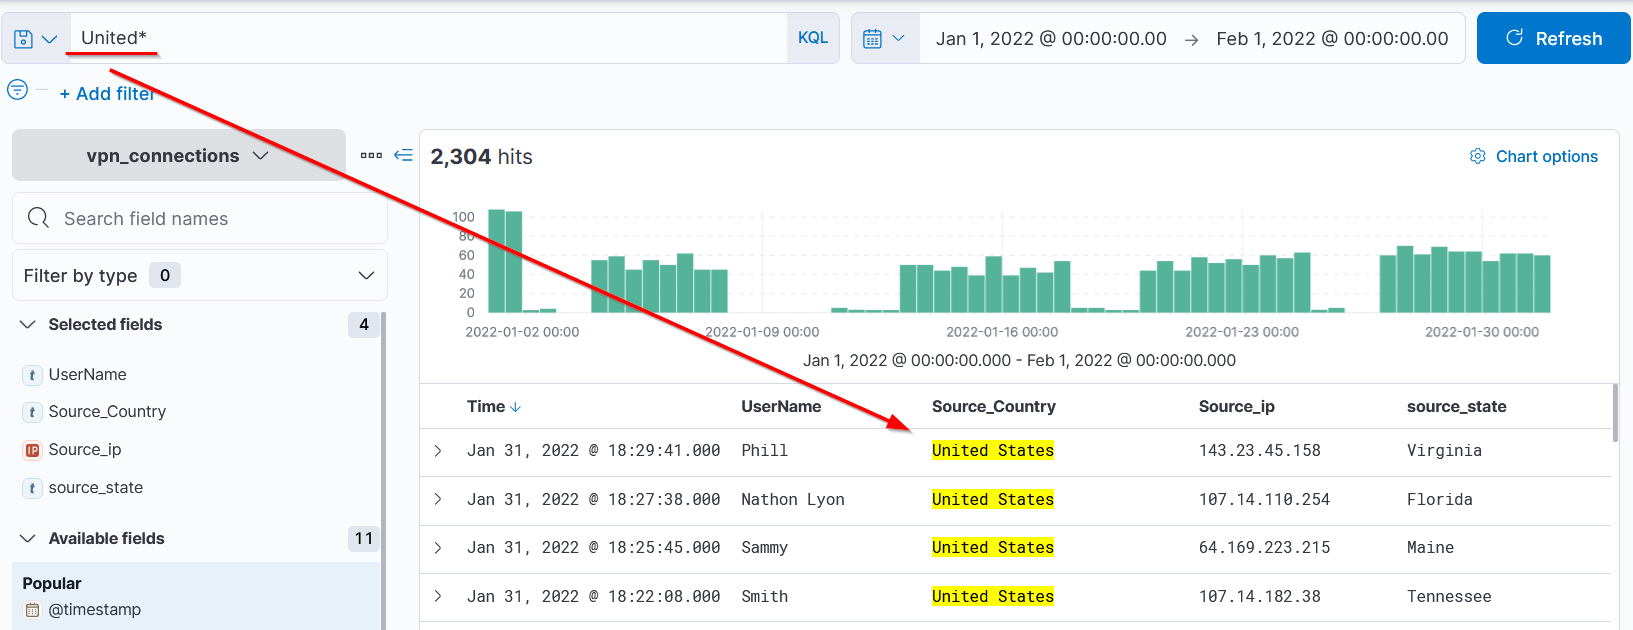
Now knowing wildcards, let’s search United* and see the results:
Logical Operators
KQL supports logical operators (AND | OR | NOT), quick examples:
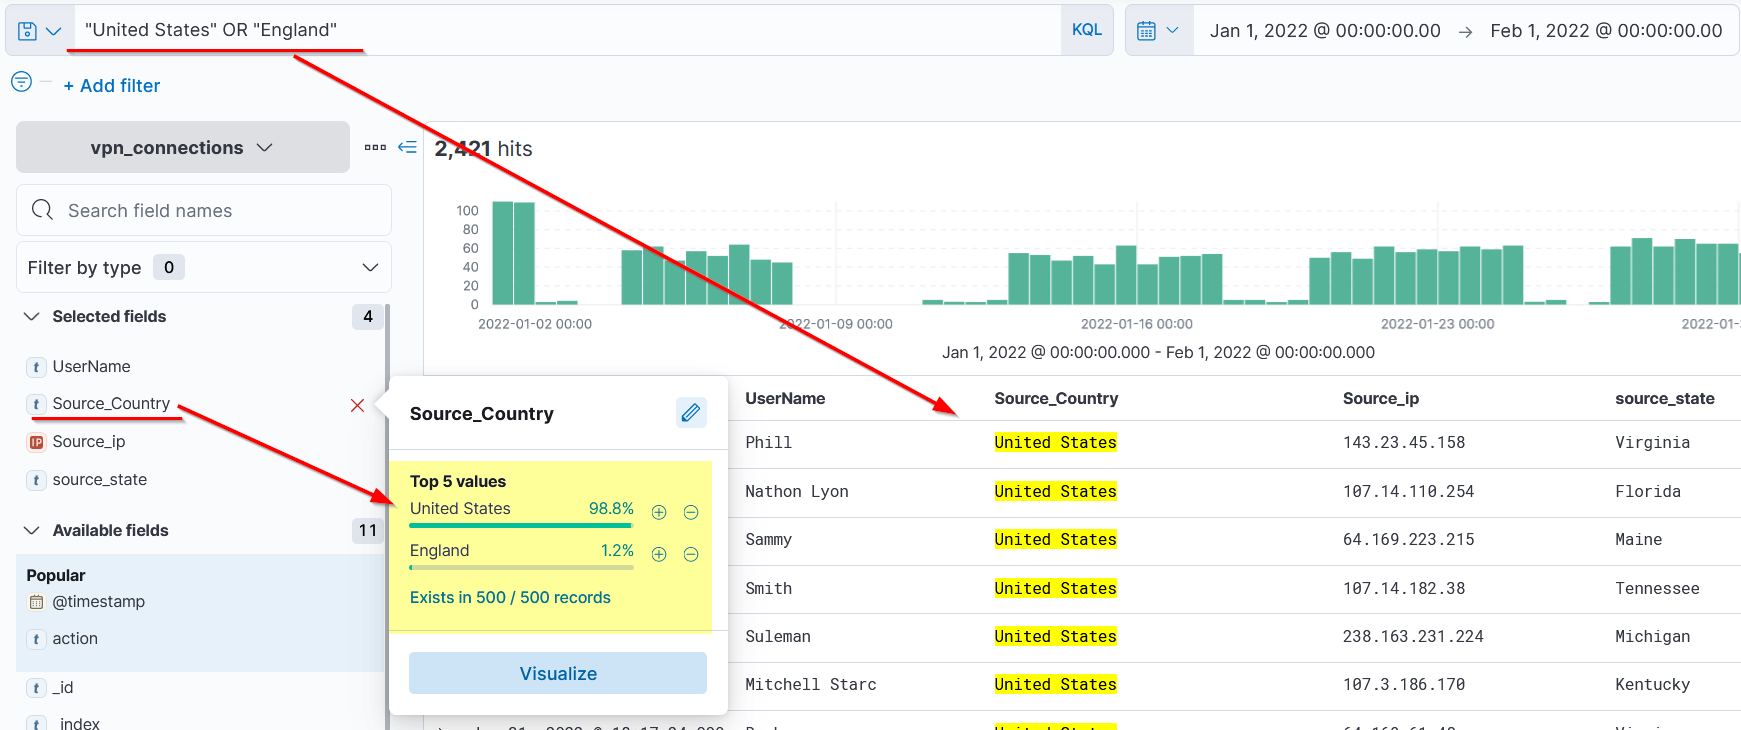
OR
Search: "United States" OR "England"
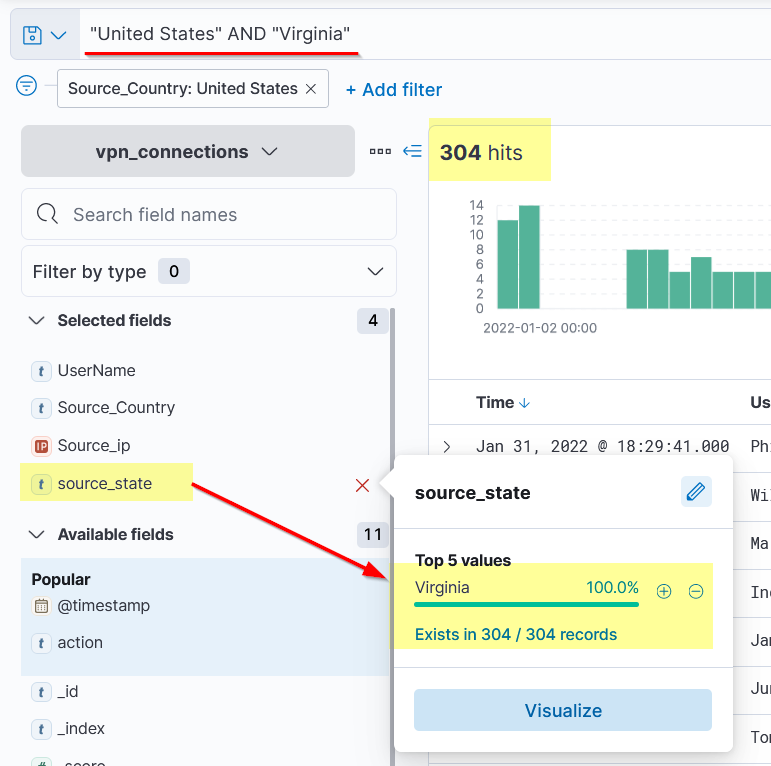
AND
Search: "United States" AND "Virgina"
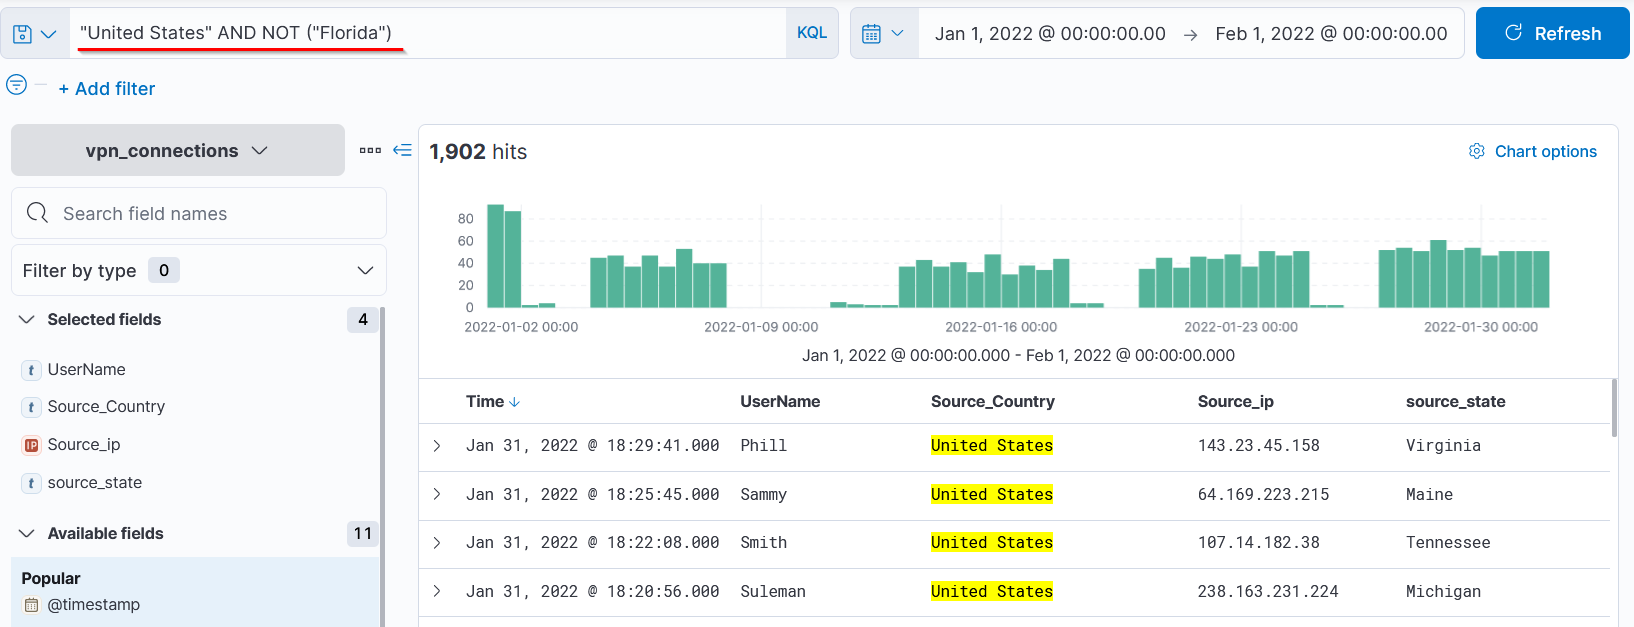
NOT
Search: "United States" AND NOT ("Florida"), Saying all the results that match United States without florida.

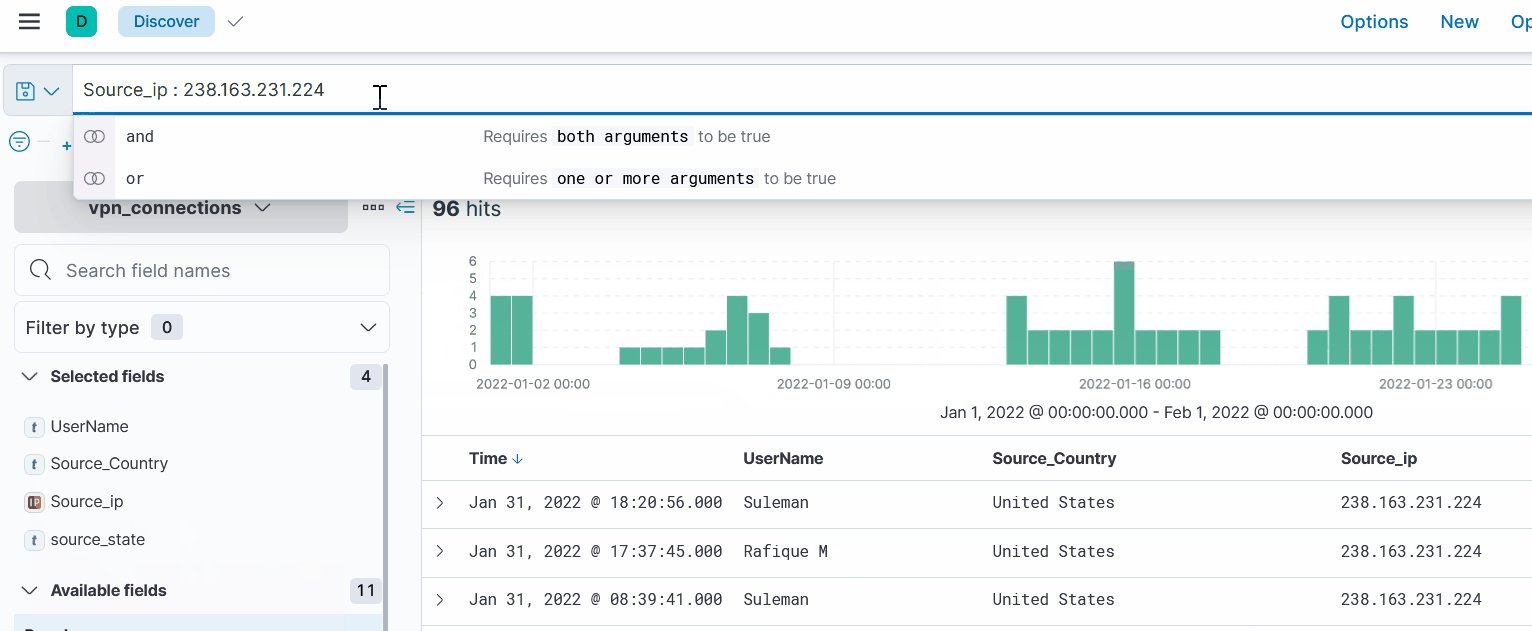
Field-based search
Here you can search for a specific value in a field, using the semicolon “:” being field:value.
Look at this example:

Kibana automatically will show you available fields and values, making your search easier.
Visualize
Visualizing is using an built-into kibna elastic application called lens that helps us read with statistics, for example in this image we can view all the connections made to a VPN.
We can visualize by clicking the wanted field in the fields pane and clicking on visualize:
We can edit the rules as we want, by clicking the field, in this example the rows top values of usernames:
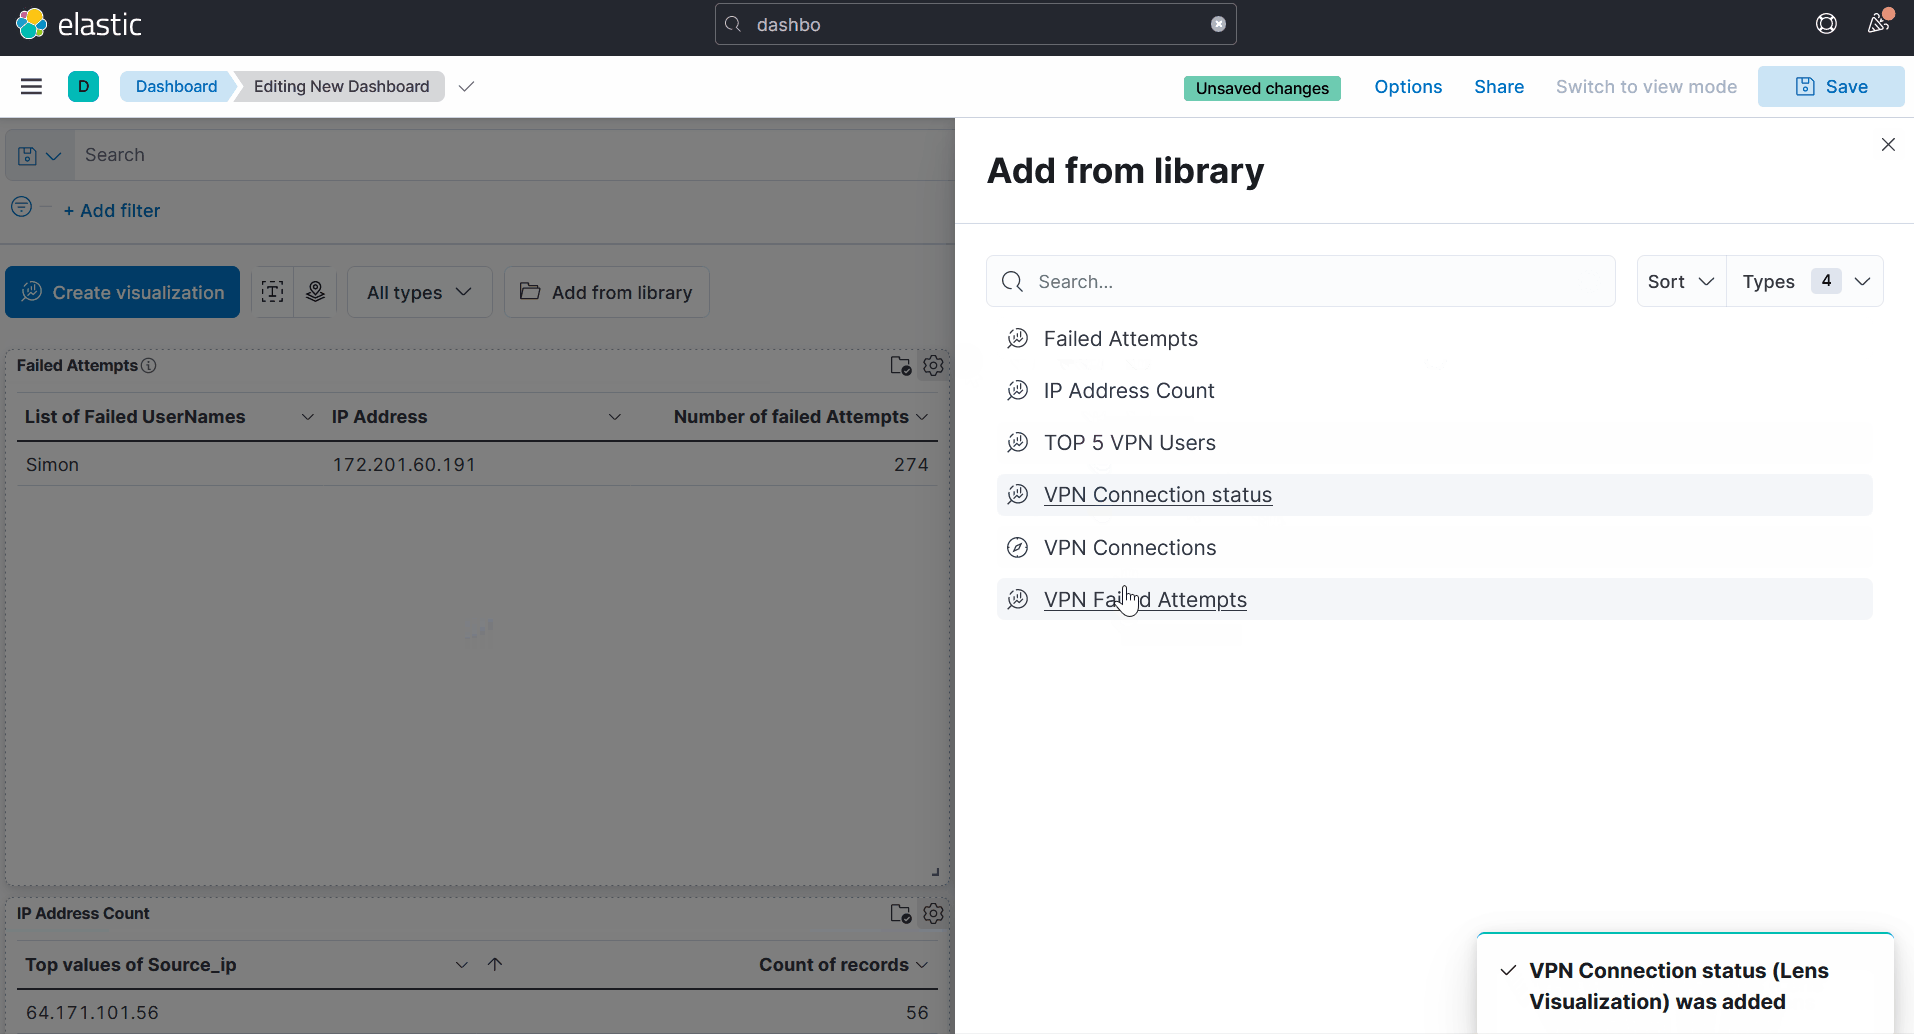
There are endless possibilites, you can save them as well and add it to your dashboard.

Like so:

Where to go from here?
- Put your knowledge to the test with the ItsyBitsy machine, where you will need to investigate an alert by IDS regarding a potential C2 communication, here is the link
- Set up your own kibana instance with sample data! You can do so with a virtual machine (Ubuntu 22.10 or Debian 11 is perfect) and start playing around!
- Read the docs